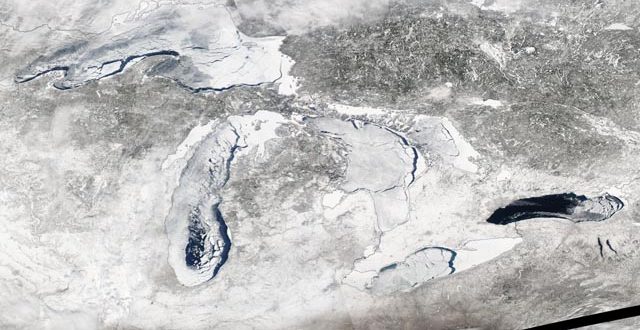
NOAA GLERL’s ice cover dataset extends from 1973 to present, serving the Great Lakes community in research, application, and management. Large interannual and decadal variability are observed, as well as a downward trend.
The map shows the extent of the maximum ice cover on the Great Lakes for each year. Data is from the U.S. National Ice Center and Canadian Ice Service. Satellite data is combined with other sources to translate daily ice charts into a pixel grid of percent cover.
The graphic illustrates not only the year-to-year variability in ice cover, but the trends that emerged over time — from the low-ice years of the late 1990s to the near total ice cover on the lakes over the brutal winters of the late 1970s, as well as in the two winters prior to this past, relatively mild one.
It all underscores the various factors that are driving ice cover, and the natural variability, said Andrew Gronewold, a hydrologist at the Ann Arbor-based research laboratory.
The most obvious influencers of whether Michigan has open water or icy plains on its Great Lakes in winter are air and water temperatures. But there are several other factors, Gronewold said, including solar radiation, cloud cover and wind speed. And those factors in turn can be driven or changed by continental or even global weather phenomena, he said.
A very strong “El Niño” weather pattern — a periodic warming of near-surface waters in the Pacific Ocean around the equator that drives air temperatures and wind patterns — in the winter of 1997-1998 left the Great Lakes with very little ice cover, even on Lake Superior, Gronewold noted. And the so-called “polar vortex,” persistent jet stream patterns that dipped frigid Arctic air over the Great Lakes for long periods, meant near-total Great Lakes ice cover in the winters of 2013-2014 and 2014-2015, he said.
“That was a global event that had a major impact here,” Gronewold said.
Researchers use the mapped ice cover data to notice variability, examine the various weather factors occurring at the time, and either reinforce their knowledge base or add to it.
“It improves our models to help predict what’s going to happen in the future,” Gronewold said.
New/improved: #interactive #animation showing 44 years of #ice on the #GreatLakes! https://t.co/BbvAczsqtW #dataviz pic.twitter.com/NIeWANjqQj
— NOAA Great Lakes Environmental Research Laboratory (@NOAA_GLERL) May 9, 2016
Agencies/Canadajournal
 Canada Journal – News of the World Articles and videos to bring you the biggest Canadian news stories from across the country every day


